
COA and batch documentation
KPV COA Explained: Reading the Report for Batch 2027602
Read KPV report LYO-0791: match batch 2027602, interpret 10.48 mg content, >99.8% purity and 0.157 EU/mg endotoxins.
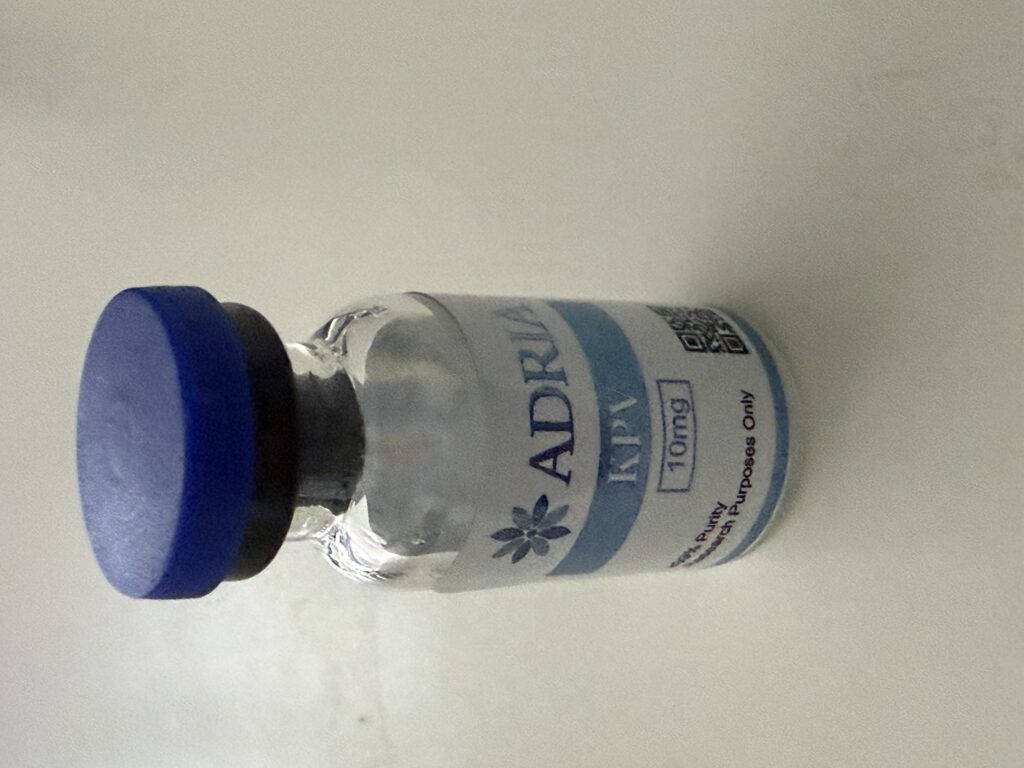
What does a peptide certificate of analysis actually tell you? In our four guides, we explained why identity, purity, content and contamination need to be assessed separately. Here we apply that approach to a real Adria Science sample: KPV 10 mg, batch 2027602.
The source is Liquilabs report LYO-0791, published 8 September 2026. It was the latest published report mapped to this KPV variant when this article was prepared on 15 September 2026. We checked that the complete PDF in our library matched the file returned by the laboratory’s verification link.
Open the complete 10-page report ↗ · Verify with Liquilabs ↗
In this article
1. Start with the sample, not the percentage
Before comparing test results, establish exactly which material the document describes. Page 1 identifies KPV 10 mg, batch 2027602 and report LYO-0791. In the Adria Science catalogue, this is the 10 mg KPV variant, SKU AS-VL-1025.
The actual vial photographs
Pages 2 and 3 contain the laboratory’s photographs of the submitted vial. One shows the product name and nominal amount; the other shows the batch label. The photographs below are extracted from that report without changing the label or adding a new batch number.
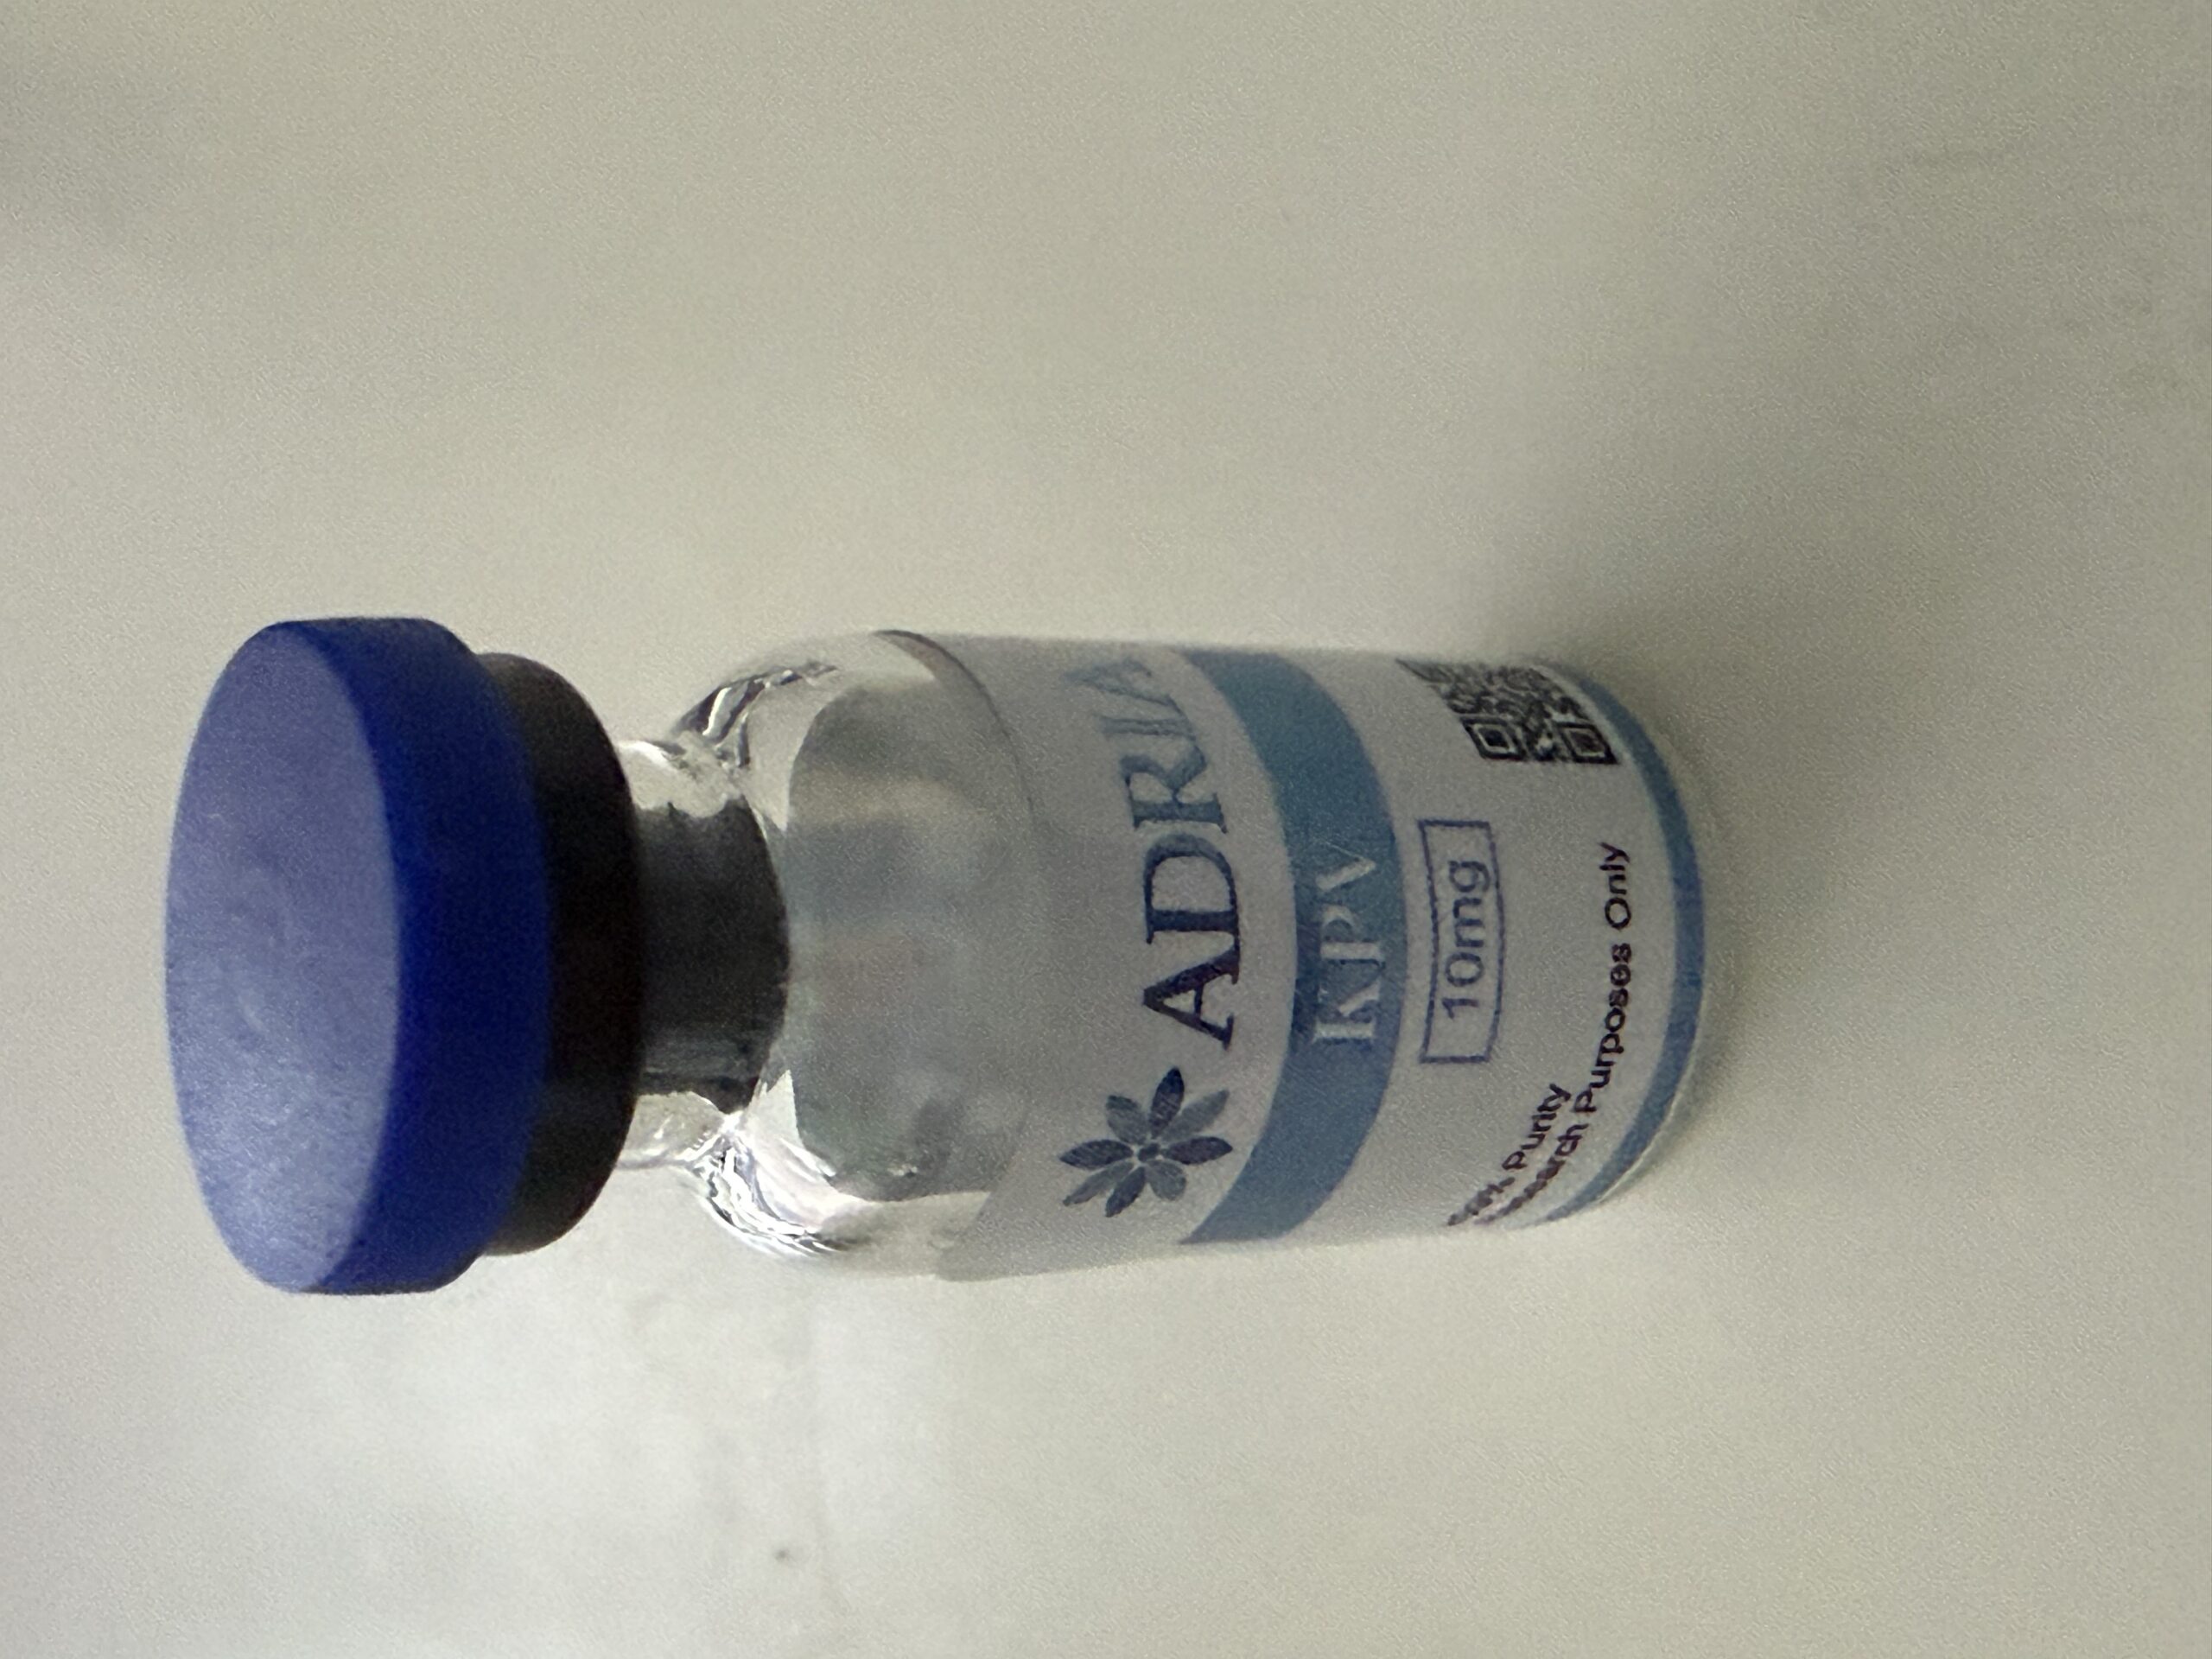
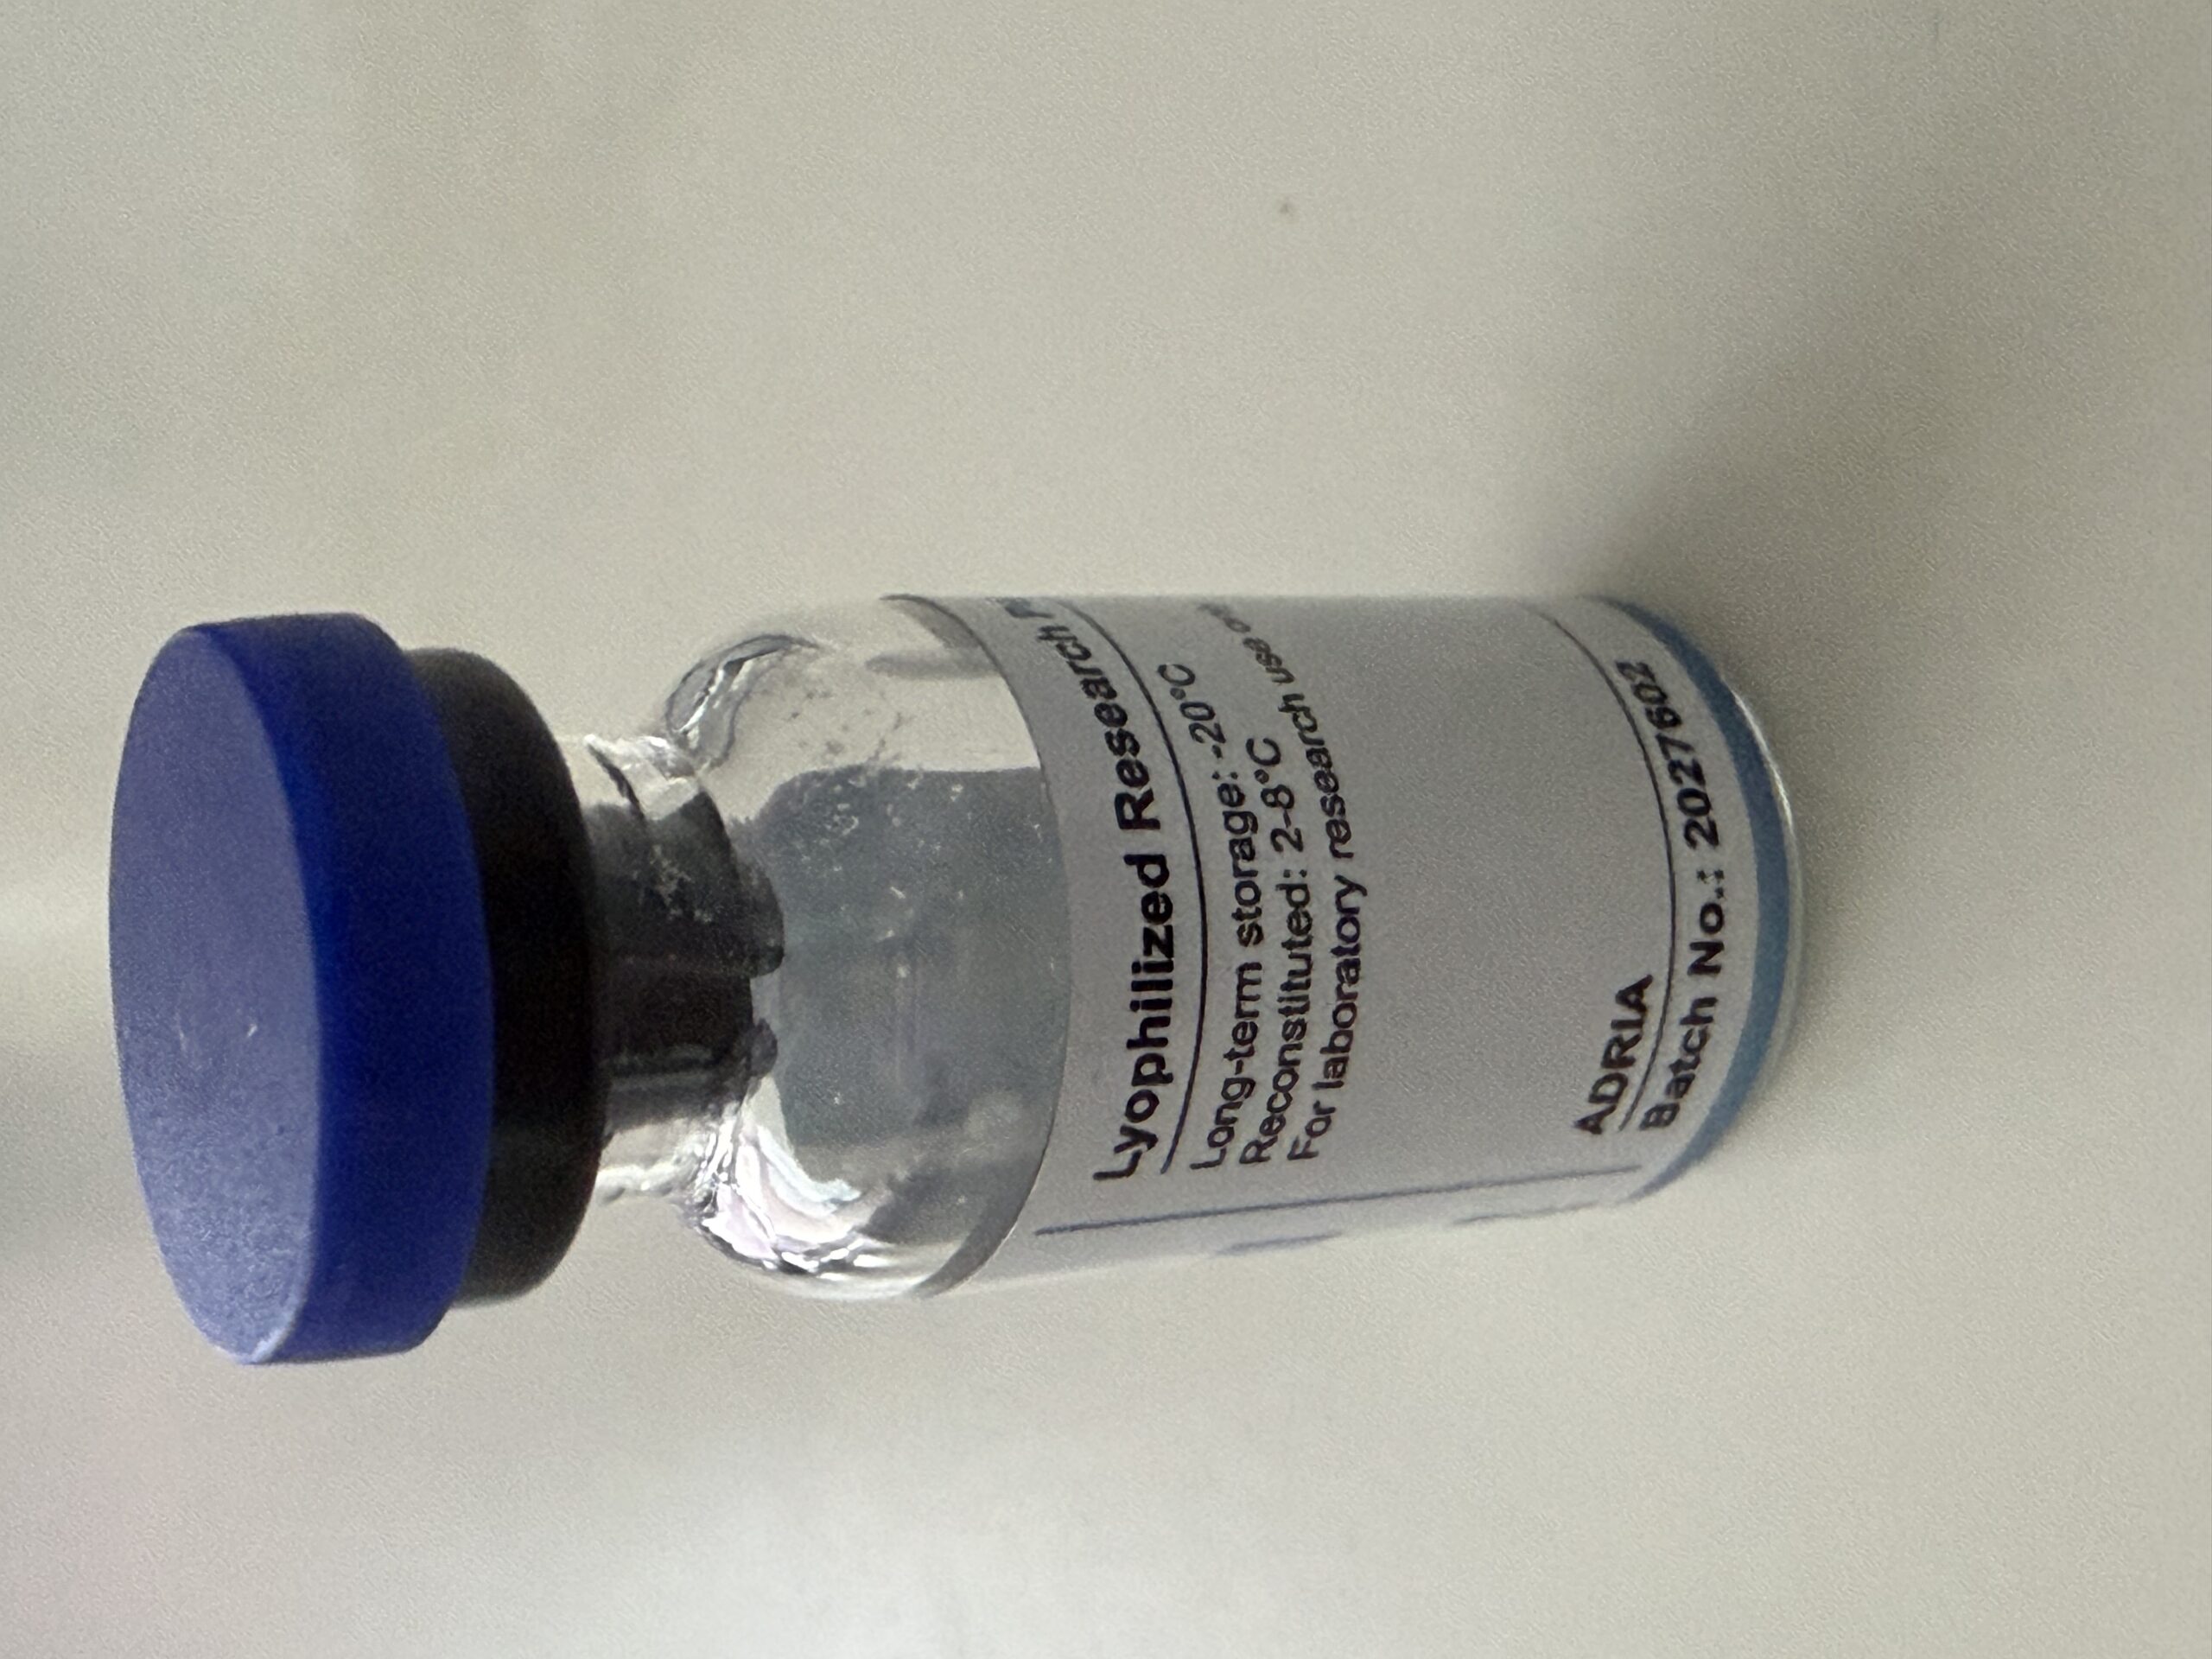
A matching photograph strengthens traceability, but does not establish the contents of every vial. The report concerns the submitted sample. The batch dispatched for a new order is confirmed when stock is allocated; compare the received label with the corresponding report.
For the general verification process, see our guide to checking a peptide COA and its laboratory source.
2. Read each result with its unit
These are the values on the signed summary page. The uncertainty entries are reproduced as reported; the document does not specify a confidence level or coverage factor beside them.
| Test | Reported result |
|---|---|
| KPV assay | 10.48 mg ±0.05 mg |
| KPV purity | >99.8% |
| Identification by spectrum (FTIR) | 995 ±5 |
| Identification by RT | 0.984 ±0.005 |
| Bacterial endotoxin, chromogenic | 0.157 EU/mg ±0.003 EU/mg |
The summary’s acceptable-range fields are blank. We therefore describe these as reported results, without inventing a universal pass/fail threshold.
3. Content: what does 10.48 mg mean?
The vial is labelled 10 mg; the laboratory reports an assay of 10.48 mg with ±0.05 mg uncertainty. As a simple comparison with the nominal label, 10.48 ÷ 10 × 100 = 104.8%. This is 0.48 mg above the nominal amount in the tested sample. It is not a new purity result, and it does not establish a production-wide filling tolerance.
Why calibration matters
Pages 4 and 5 describe the content method and a four-point external-standard calibration. The calibration graph reports R² = 0.9992. This describes the fit of that calibration model; it should not be converted into a claim that the product is “99.92% accurate” or “99.92% pure.”
The method pages describe sample preparation and dilution as part of the laboratory analysis. Those details are analytical context, not preparation instructions for a customer’s experiment.
A unit distinction worth checking
The chromatography output on page 7 labels its concentration column in mg/L, while the summary gives the assay in mg. Concentration and total amount are different quantities. Reconstructing a vial amount from the chromatogram requires the complete dilution, volume and reporting calculations. We use the laboratory’s final assay result and do not assume the displayed concentration alone is the vial content.
4. Purity: why we retain “greater than 99.8%”
Page 6 describes purity by area normalization at a detection wavelength of 225 nm. Page 7 shows the KPV chromatogram and a peak table with the KPV peak at 6.787 minutes. The table assigns the listed peak 100.000% of the integrated area in that output.
The signed summary reports >99.8%, so that is the purity result we communicate. A 100.000% entry in a peak table does not demonstrate the complete absence of impurities. Detection, integration, separation and the chosen wavelength define what the chromatogram can show.
HPLC area purity compares detector responses. A material that is not detected by that method does not become part of the percentage simply because it may be present. Water, some salts and contaminants needing other methods cannot be ruled out from this number alone. Different compounds may also produce different responses.
Our HPLC purity guide explains why chromatographic purity and measured peptide content must remain separate.
5. Identity: read the entries without changing their meaning
The summary includes identification by spectrum, labelled FTIR, at 995 ±5, and identification by RT at 0.984 ±0.005. These are identification entries, not percentages of material in the vial.
The numerical RT entry should also not be confused with the 6.787-minute retention time printed in the chromatogram. The ten-page package does not explain the scale and acceptance criteria for both summary identification values in enough detail to reconstruct their evaluation independently. A reader needing that level of confirmation should obtain the comparison criteria and underlying spectral evidence from the laboratory.
Listing a mass-spectrometry detector among the instruments is not the same as providing a sample-specific mass spectrum. This report does not present a KPV molecular-ion result that we could quote as additional identification evidence.
6. Endotoxins: a separate measurement with its own context
The summary reports 0.157 EU/mg ±0.003 EU/mg using a chromogenic bacterial-endotoxin method referencing USP <85> and European Pharmacopoeia 2.6.14. EU/mg means endotoxin units per milligram on the report’s stated basis.
This is a numerical result. It is neither a “less than” result nor evidence that the material is endotoxin-free. Whether it meets a particular research requirement depends on the intended assay, its sensitivity and the criteria established for that work. The report itself does not supply a universal acceptance limit.
Find the correct sample row in the appendix
Pages 8 and 9 contain the endotoxin calibration information and a table covering several laboratory samples. The relevant row is LYO-0791, on page 9. Other sample IDs in that table are not additional tests of this KPV vial.
The appendix contains intermediate concentration, absorbance and dilution entries. They are not interchangeable with the final normalized result of 0.157 EU/mg. For an independent audit, request the sample-specific calculation and assay suitability evidence, including interference and recovery checks, from the laboratory.
High chromatographic purity does not remove the need for endotoxin testing. Equally, an endotoxin result does not establish sterility or describe every type of microbial contamination.
Read more in why endotoxin testing matters in peptide quality assessment.
7. What the complete report establishes—and what remains outside it
The ten pages include a results summary, two vial photographs, analytical method and calibration information, a chromatogram, endotoxin supporting data and a signed closing page. The closing statement limits the results to the samples tested.
The package does not present results for a residual-solvent panel, elemental impurities by ICP-MS, total aerobic microbial count, yeast and mould count, or a sterility test. We do not interpret their absence as a passing result or add those tests to this batch’s claims.
Method details to clarify when a decision depends on them
The summary names a peptide-screening method with 0.1% TFA, while the method appendix describes ammonium-formate mobile phases and a HILIC column. Those labels should be reconciled by the laboratory when exact method identification matters. Likewise, the mg/L-to-mg calculation and the identity scoring criteria need their underlying documentation for a full independent reconstruction.
These observations do not let us conclude that the measured results are wrong. They show why a credible reading separates the values the laboratory reports from details that a reader cannot independently verify from the supplied pages alone.
This article is an explanation of one analytical record. It does not establish medical suitability, biological performance, stability over time or identical results across every vial. Adria Science products are supplied for research use only.
8. A practical checklist for your next COA
- Match identity: product, stated amount, batch and laboratory sample ID.
- Check provenance: open the complete report and use the issuing laboratory’s verification route.
- Separate measurements: content, chromatographic purity, identity and contaminants are different questions.
- Keep the units: mg, mg/L, area%, EU/mg and numerical identity entries cannot be substituted for each other.
- Read the appendices: find the correct sample row and compare it with the signed summary.
- Define the decision: check whether the test scope and acceptance criteria suit your research requirements; clarify missing information before relying on it.
For the broader framework, return to our comprehensive guide to laboratory peptide quality assessment.
Frequently asked questions
Is this KPV “100% pure”?
The result on the summary is >99.8%. We retain that wording. The peak table’s 100.000% entry does not prove absolute purity.
Does this report mean the vial is sterile?
No sterility result is presented in this report. Endotoxin testing and sterility testing assess different properties.
Will my order contain batch 2027602?
This walkthrough concerns the tested sample from batch 2027602. The dispatched batch depends on stock allocation. Check your vial label and the matching report, or contact Adria Science to confirm your allocated batch.
Where can I see all of the original pages?
Open the complete original LYO-0791 PDF. The product and batch photographs are on pages 2 and 3; the chromatography output is on page 7.
Explore the documented product: KPV 10 mg · Browse the COA library.
Source: Liquilabs s.r.o., LYO-0791, published 8 September 2026. Editorial review: Adria Science, 15 September 2026. Photographs remain unaltered; the full laboratory report is linked throughout. This article does not replace the report.